
I’d start with O*NET for U.S. job tasks - not a job-loss forecast. Its 1–5 score describes current automation. OECD measures add context on AI exposure, while WorldJobsData and Tembrica offer scores with less detail about how they’re calculated.
I compare all four by data source, occupation coverage, score meaning, update date, cost, and explanation. My rule: <u>match the tool’s occupation to your actual duties</u> before using its results.
Quick Comparison
| Tool | Source and coverage | Score and explanation | Update information | Cost |
|---|---|---|---|---|
| O*NET | Worker and expert surveys; nearly 1,000 U.S. occupations | 1–5 current automation score; task details help explain it | Varies by occupation and release | Free |
| OECD | Occupational and skills research; cross-country coverage | AI exposure and broader automation measures; published methods | Varies by study | Free |
| WorldJobsData | Sources not disclosed; occupational groups across 100+ countries | Separate 1–10 AI and robotics scores; calculation not disclosed | Page dated May 11, 2025; data dates unknown | Free; no registration reported |
| Tembrica | Lists O*NET, BLS, and Anthropic data; full coverage not listed | Percentage estimate and time scenarios; calculation not disclosed | No reliable data date supplied | Not established |
I’d use these tools to flag tasks worth studying, not to predict whether you’ll lose your job. Before acting, check the live source, its dates, and its access terms.
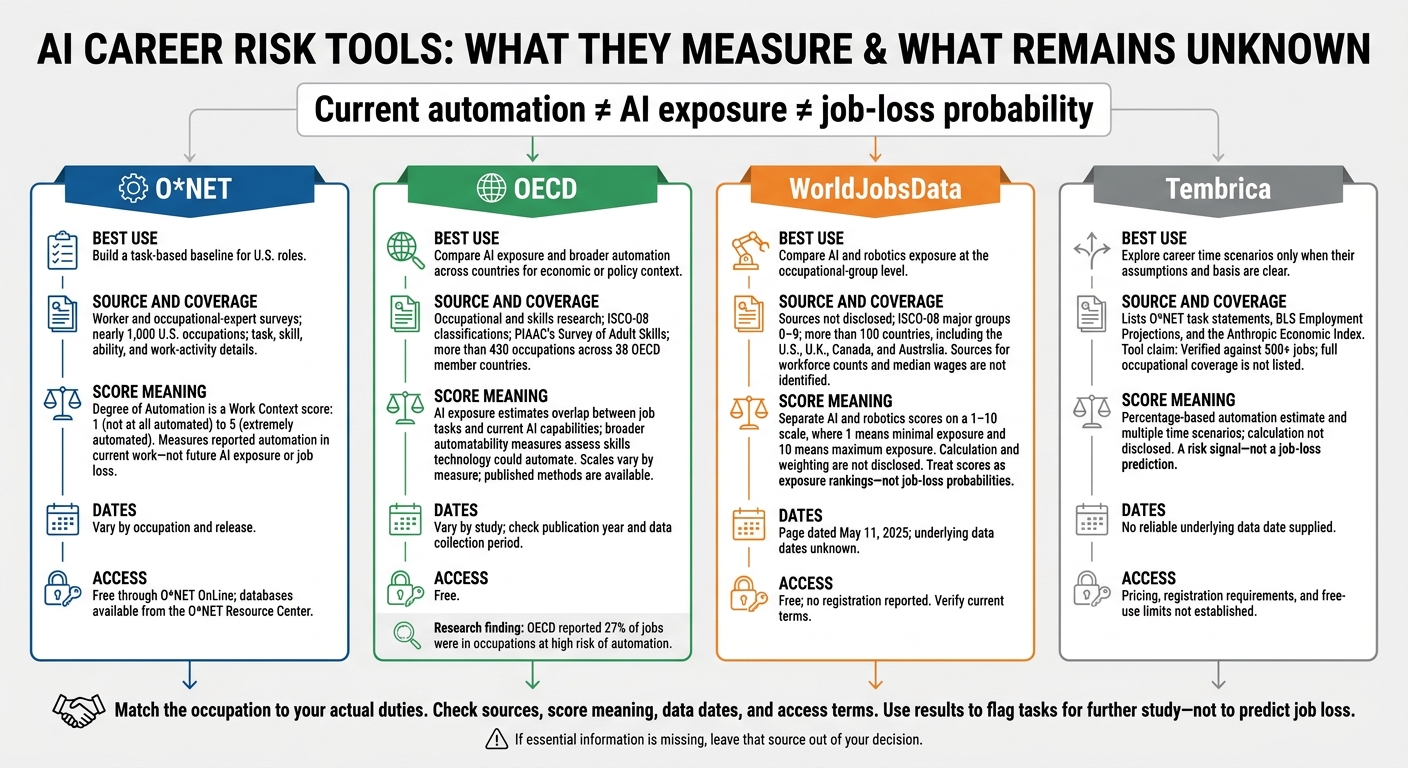
AI Career Risk Tools: What Their Scores Really Mean
1. O*NET Degree of Automation
Data and occupational coverage
O*NET provides a U.S.-only baseline covering nearly 1,000 occupations. Its standardized Content Model describes tasks, skills, abilities, and work activities.
Use that task-level detail to interpret the automation score. The score alone doesn’t tell the whole story.
Scoring and explanations
Degree of Automation is a Work Context score drawn from worker and expert surveys. It uses a five-point scale, from 1 (not at all automated) to 5 (extremely automated).
The score reflects reported automation in current work - not future AI exposure.
Updates and uncertainty
O*NET updates in waves, so update dates vary by occupation. Check the Database Releases page for version history and occupation-level dates.
Pricing and access
Access is free through O*NET OnLine. You can also download databases from the O*NET Resource Center.
The next section looks at OECD measures for cross-country comparison.
2. OECD AI Exposure and Automation Measures
Data and occupational coverage
Unlike O*NET, OECD measures use ISCO-08 occupational classifications and draw on PIAAC’s Survey of Adult Skills to assess work tasks. The framework covers more than 430 occupations across 38 OECD member countries. When comparing tools, match the occupation definitions - not just the job titles.
Scoring and explanations
AI exposure measures estimate how closely a job’s tasks overlap with current AI capabilities. Broader automatability measures estimate which skills technology could automate. The OECD reported that 27% of jobs were in occupations at high risk of automation.
Updates and uncertainty
Each measure reflects research from a specific point in time. Before comparing scores, check both the publication year and the data collection period.
Pricing and access
OECD resources are free to access. Read the method notes and occupation definitions alongside the scores. Next, compare this broad cross-country framework with WorldJobsData’s occupation-level scoring.
3. WorldJobsData
Data and occupational coverage
WorldJobsData uses ISCO-08 major groups (0–9) and covers more than 100 countries, including the U.S., U.K., Canada, and Australia. It shares OECD’s occupational framework, which makes comparisons easier. But it offers less detail about its methods than OECD’s documented research base.
The page doesn’t identify the sources of its workforce counts or median wages. Check that the country, currency, year, and occupation match before comparing figures.
Scoring and explanations
WorldJobsData provides separate AI and robotics scores on a 1–10 scale, where 1 means minimal exposure and 10 means maximum exposure. These scores let you compare occupations at a glance.
The method and weighting aren’t disclosed, so treat the scores as exposure rankings - not job-loss probabilities.
Updates and uncertainty
The page is dated May 11, 2025, but it doesn’t state when the underlying data was collected.
Pricing and access
The tool is free, with no registration or paywall. Use it for a quick first check, but make sure the occupation score and source details are visible before comparing results.
Tembrica shifts the focus from broad coverage to how clearly a tool explains its score.
4. Tembrica
Data and occupational coverage
Tembrica puts more emphasis on explanations than broad coverage. Its “Will AI Replace Me?” tool on mystic.ai assesses a range of professions at the occupation level and says it has been verified against 500+ jobs. It does not list the full set of U.S. occupations covered.
The tool uses O*NET task statements, BLS Employment Projections, and the Anthropic Economic Index to compare AI capabilities with human work requirements. The score alone isn’t enough to judge it - what Tembrica discloses also matters.
Scoring and explanations
Tembrica provides a percentage-based automation estimate but does not explain how it calculates that score. Treat it as a risk signal, not a job-loss prediction.
Updates and uncertainty
The supplied material provides no reliable update date or date for the underlying data.
Pricing and access
The supplied material does not establish pricing, registration requirements, or free-use limits. Check the live site’s terms before sharing information or paying. These details matter when comparing Tembrica with other tools’ sources, scores, dates, and costs.
sbb-itb-20a3bee
Will AI Actually Take Your Job? Here's What the Data Say.
Compare Sources, Scores, Dates, and Costs
The comparison below focuses on four details that can be checked across tools: source, scale, date, and cost.
Data Sources and Occupation Coverage
Start with how each tool defines occupations. O*NET and OECD disclose their methods. WorldJobsData and Tembrica share less detail.
What the Scores Measure and Explain
Automation, AI exposure, and displacement risk measure different things. Don’t rank their scores directly against one another.
Update Dates and Uncertainty
The source summary lists May 11, 2025, as the latest verified update for Will AI Replace Me? on mystic.ai. The other tools’ underlying data dates aren’t provided here.
Access terms matter as much as how recently a tool was updated. Check current pricing and access terms before use.
Use the table to see what each tool shares - and what it leaves out.
| Resource | Source data | Scoring unit | Score scale | Update information | Pricing |
|---|---|---|---|---|---|
| O*NET | Worker and occupational-expert surveys | Occupation; Work Context element | 1–5 | Varies by occupation and release | Free |
| OECD | Occupational requirements and skills data | Occupational exposure or automatability | Varies by measure | Varies by study | Free |
| WorldJobsData | Not disclosed | Occupational group; separate AI and robotics scores | 1–10 | Page dated May 11, 2025; underlying data dates not disclosed | Free; no registration |
| Tembrica | O*NET tasks, BLS Employment Projections, Anthropic Economic Index | Occupation | Percentage estimate; calculation not disclosed | Underlying data dates not disclosed | Not disclosed |
When using these tools to support a decision, weigh source quality, score meaning, time since the last update, and access cost. Their scores aren’t predictions.
Pros, Cons, and Best Uses
Match each tool to the question it answers best.
| Resource | Advantages | Disadvantages and unresolved limits | Best comparison use |
|---|---|---|---|
| O*NET | Standardized U.S. data on occupational tasks and skills. | Doesn’t forecast job losses. Use it only as a task-level baseline. | Build a task-based baseline for U.S. roles. |
| OECD | Research-based analysis of AI exposure and automation across countries and sectors. | Isn’t a personal tracker or a real-time risk score. | Compare exposure across countries for economic or policy context. |
| WorldJobsData | Separates AI exposure from robotics exposure. | Occupation groups limit the detail available. A group may not reflect your specific role. | Compare AI and robotics exposure at the occupational-group level. |
| Tembrica | Compares multiple time horizons. | Its usefulness depends on disclosed sources, assumptions, and uncertainty ranges. The supplied documentation leaves these limits unresolved. | Assess career scenarios only when the basis for each timeframe is clear. |
Then choose the level of detail you need.
For U.S. roles, start with the task match. Compare O*NET’s tasks and skills with your actual duties, then use OECD research to add broader context.
Treat Tembrica’s time horizons as scenarios, not predictions.
Conclusion: Choose by the Question
Choose the source based on the question you need answered. Use O*NET to map a U.S. occupation’s tasks and baseline automation context. Use OECD measures to separate exposure to specific AI capabilities from broader automation trends.
Before using WorldJobsData or Tembrica, check the occupation match, what the score measures, its update date, pricing, and how it’s calculated. If any of that information is missing, leave the source out of your decision.
Compare the scores with your actual tasks. Use them to flag tasks for further study - not to predict job loss.
FAQs
How do I assess a role with mixed duties?
Sort your weekly duties into three groups:
- Automatable: Routine tasks that follow set rules.
- AI-assisted: Tasks you can improve with AI tools.
- Human-led: Tasks that call for judgment, accountability, safety or compliance oversight, and relationships.
Compare overlapping skills and duties - not just job titles - and name who owns the results.
For human-led tasks, require evidence: measurable outcomes, quality and accountability checks, and records of exceptions handled. Update that evidence every 3–6 months as duties change. [2][3]
What should I do if risk scores disagree?
When risk scores disagree, check how each assessment interprets the job title, seniority, and qualifications - and whether any information is missing. Give more weight to supporting evidence, not the most favorable score. Check AI findings against official job postings, company websites, or U.S. Bureau of Labor Statistics data.
Treat AI findings as guidance, not instructions. Weigh the evidence alongside your judgment, professional goals, and advice from mentors or career counselors as you plan your next steps.
How can I turn AI exposure into a skills plan?
Sort your weekly tasks into three groups: AI-resistant, AI-augmented, and AI-vulnerable. Focus your learning on AI-augmented tasks and learn to use the tools built for your field.
Compare your skills against 15–20 current job postings to spot baseline requirements and skills employers prize most. Then build a 90-day reskilling plan around your top three skill gaps, moving from basic literacy to application and integration.
Before you commit to formal training, test your fit with small, low-cost projects.