
If you don’t track your personal brand, you’re guessing. A simple dashboard can show whether your LinkedIn work, portfolio updates, applications, and interview prep are leading to more profile views, recruiter messages, and interviews.
Here’s the short version:
- I’d set clear targets like +25% LinkedIn profile views in 90 days or 3 recruiter messages per month
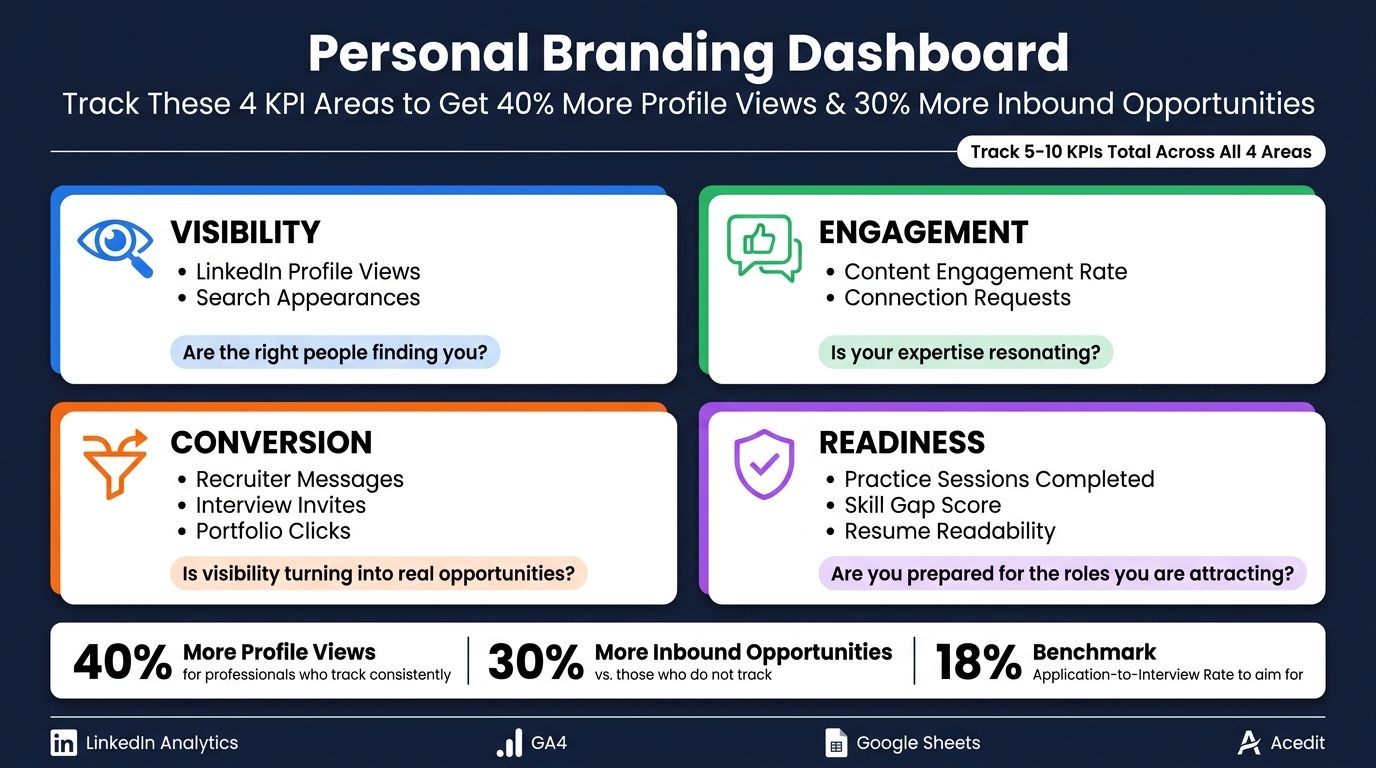
- I’d track just 5 to 10 KPIs across four areas: visibility, engagement, conversion, and readiness
- I’d pull data from LinkedIn, GA4, a spreadsheet, and Acedit
- I’d review the dashboard every Friday for 30 minutes
- I’d change one thing at a time and measure results over two weeks
- I’d watch job-search outcome metrics like application-to-interview rate and compare them with the 18% benchmark
- I’d avoid vanity numbers that look good but don’t lead to interviews
A few numbers stand out. People who track personal brand metrics on a steady basis see 40% more profile views and 30% more inbound opportunities. That’s the point of a dashboard: not more data, but better choices.
At a glance, the article comes down to this:
| Area | What I’d Track | Why It Matters |
|---|---|---|
| Visibility | Profile views, search appearances | Shows whether people can find me |
| Engagement | Post engagement, connection requests | Shows whether my content is landing |
| Conversion | Recruiter messages, interview invites, portfolio clicks | Shows whether attention is turning into job leads |
| Readiness | Practice sessions, skill gap score, resume quality | Shows whether I’m ready when interest shows up |
The big idea is simple: keep the dashboard small, current, and tied to results that matter.
Personal Branding Dashboard: 4 KPI Areas to Track for Job Search Success
Set Personal Brand Goals and Pick the Right KPIs
Turn Career Goals Into Measurable Dashboard Targets
Goals like "land a better role" or "grow my LinkedIn visibility" sound good. But they’re hard to track unless you turn them into numbers and deadlines.
That means setting dashboard targets you can actually watch over time, like more profile views, more recruiter messages, or a better application-to-interview rate.
A few clear examples:
- Increase LinkedIn profile views by 25% in 90 days
- Earn 3 recruiter messages per month
- Improve your application-to-interview rate toward the 18% benchmark
- If pay is part of the goal, set a base salary target and track offers against it
This shifts your brand from a vague career idea into something you can measure.
Track Visibility, Engagement, Conversion, and Interview Readiness
Once your goals are set, group your KPIs into four buckets so the dashboard doesn’t lean too hard in one direction.
| Metric Group | Key KPIs | Meaning |
|---|---|---|
| Visibility | Profile views, search appearances | Are the right people finding you? |
| Engagement | Content engagement rate, connection requests | Is your expertise resonating? |
| Conversion | Recruiter messages, interview invites, portfolio clicks | Is visibility turning into real opportunities? |
| Readiness | Practice sessions completed, skill gap score, resume readability | Are you prepared for the roles you're attracting? |
A good rule of thumb is to track 5 to 10 KPIs total across these four groups. That gives you enough data to spot progress without turning the dashboard into a mess.
There’s also a clear upside to tracking this stuff. Professionals who regularly monitor their personal brand metrics receive 40% more profile views and 30% more inbound opportunities than those who do not.
Once the targets are clear, pull the data from the platforms that can measure them.
sbb-itb-20a3bee
Collect Data From LinkedIn, Portfolio Analytics, and Interview Prep Tools
Use the Right Data Sources for Personal Branding
Each KPI bucket needs a clear source. LinkedIn is best for visibility and engagement. GA4 helps you track site engagement and conversion. A simple spreadsheet works well for conversion tracking. And Acedit helps you measure readiness.
LinkedIn Analytics tracks profile views, search appearances, post engagement, and follower growth. Export that data on a regular basis so you keep more than the native 90-day window.
GA4 should cover your personal website or portfolio. Pay attention to total visits, referral sources, and actions that show clear interest, like resume or portfolio downloads and clicks on projects or case studies.
For applications and interview outcomes, keep it simple. Log applications, responses, and interview invites in a spreadsheet so you can calculate your application-to-interview rate.
Add Interview Readiness Metrics With Acedit
Visibility gets people to notice you. Readiness helps you turn that attention into interviews.
That’s why it makes sense to track interview prep data next to visibility and conversion metrics. You’re not just measuring reach. You’re measuring whether you’re ready when the chance shows up.
If you use Acedit, log:
- practice interview volume
- question coverage
- answer patterns
- cover letters generated each week
This gives you a clean view of readiness inside your dashboard.
Connect Everything in Google Sheets, Looker Studio, or Power BI
Once your sources are set up, pull them into one dashboard view. Start with Google Sheets. Then automate only the metrics you check every week.
Export weekly CSVs from LinkedIn and your portfolio analytics into Google Sheets. Use one master tab with consistent column headers like Date, Platform, Metric, and Value. Stick to one date format, such as YYYY-MM-DD, and use one U.S. time zone across all records.
When the sheet feels stable, connect it to Looker Studio or Power BI. In Looker Studio, turn on auto-refresh and add filter controls for target role or content type. That way, you can quickly see which version of your brand story is landing best.
Brand Awareness KPI Dashboard in Google Sheets
Design a Dashboard You Can Review and Act On Every Week
Once your data lives in one place, turn it into a weekly decision tool instead of a monthly report.
Build Summary and Detail Views for Faster Decisions
Start with a single executive summary page. Put your top KPIs first: profile views, recruiter messages, interview invites, and practice sessions. Those numbers give you a fast read on brand visibility and job-search momentum. Everything else should sit in detail views.
Here’s how each view connects to a decision:
| View | Primary KPIs | Update Frequency | Decisions Enabled |
|---|---|---|---|
| Executive summary | Profile views, recruiter messages, interview invites, practice sessions | Weekly | Check overall momentum |
| LinkedIn performance view | Search appearances, post engagement, follower growth, profile clicks | Weekly | Refine headline, sections, and posting cadence |
| Portfolio traffic view | Sessions, traffic sources, project-page views, conversion clicks | Weekly or monthly | Improve featured projects and calls to action |
| Interview readiness view | Acedit practice volume, topic coverage, answer quality, mock interview completion | Weekly | Set practice focus and coaching priorities |
Begin with the summary page. Then open a detail view only when that top-level snapshot gives you a reason to dig deeper. That way, you spend less time clicking around and more time making calls.
Pick Charts That Fit the Metric and Cut the Clutter
The chart type matters just as much as the data. Use scorecards, sometimes called KPI tiles, at the top of your summary page for headline numbers like total interview invites or weekly profile views. They’re the fastest format to scan, and they make week-over-week movement easy to see.
Use line charts for trends over time. Use bar charts when you want to compare items side by side, like which post type drove the most engagement last month.
Keep one simple rule in mind: one insight per chart. If you can’t read the point of the chart at a glance, simplify it or remove it.
| Chart Type | Best Use |
|---|---|
| Line chart | Weekly or monthly trend tracking |
| Bar chart | Comparing posts, channels, or content categories |
| Scorecard | Headline KPI totals and change vs. prior period |
Add date range filters so you can check week-over-week changes fast.
Use this layout to see what changed before you decide what to adjust.
Use Dashboard Data to Improve Visibility, Content, and Interview Performance
Run Weekly Reviews and Make Small, Measurable Changes
Once the dashboard is built, use it to decide what to adjust next.
Set aside 30 minutes every Friday to review it. Look at the same visibility, engagement, conversion, and readiness KPIs you already track. Use last 7 days and last 30 days side by side. The 7-day view helps you spot sudden drops or spikes. The 30-day view shows whether a change is doing its job.
It also helps to keep the process tight. Limit yourself to three changes per week so you don't get buried in numbers or change too much at once.
For example:
- If profile views have flattened, test a new LinkedIn headline with stronger keywords and give it two weeks before you judge the result.
- If a post format fell flat, switch to another format, like a video or infographic, then compare engagement the following week.
Change one thing at a time for two weeks. After that, compare profile views and recruiter messages.
Use Engagement Data to Refine Interview Stories and Prep
The same data you use to shape content can also sharpen interview prep.
When a post about a certain project, skill, or career challenge gets far more likes, comments, and shares than your usual posts, that topic is landing with your professional audience. There's a good chance it'll land with recruiters too. Turn those top-performing topics into two or three interview stories. Those are the stories worth rehearsing the most.
If your interview conversion rate - (Interview Invitations ÷ Total Profile Views) × 100 - drops below 18%, spend more time practicing and tighten your answers. This is where Acedit's interview simulations can help. Use them to practice for the exact roles and competency gaps your dashboard has flagged, especially if your Skill Gap Score is high. That way, your branding, content, and interview prep all point in the same direction.
Conclusion: Keep the Dashboard Simple, Current, and Tied to Outcomes
The best branding dashboard isn't the most complex one. It's the one you open every week and actually use.
Start with clear career goals. Turn those goals into a focused set of KPIs. Pull data from sources you can keep updated without a ton of hassle. Then build views that make decisions obvious, not draining.
The most common mistakes are pretty simple:
- Tracking vanity metrics that feel good but don't connect to job-search outcomes
- Skipping weekly updates until the data gets old
- Adding so many metrics that no single number points to a clear next step
Professionals who track their personal brand metrics on a steady basis get 40% more profile views and 30% more inbound opportunities than those who don't.
Keep it simple, keep it current, and tie every metric to a real outcome: more visibility, stronger content, and better interview performance.
FAQs
How do I choose the right KPIs for my personal brand?
Start by setting clear goals. That keeps you from drifting toward vanity metrics like follower counts with no context.
A simple way to stay on track is the rule of three: pick three core metrics and review them every week.
Your KPIs should cover three areas:
- Visibility: profile views
- Credibility: engagement rates
- Business outcomes: interview invitations
Acedit can help you track these numbers and adjust your approach as you go.
What should I do if my dashboard shows strong visibility but few interviews?
If your dashboard shows high visibility but few interviews, people are noticing you. The issue is that your resume, profile, or the way you frame your experience may not be turning that attention into next steps.
Start by checking your resume for two things: readability and fit. Is it easy to scan? Does it line up with the roles you want?
You can also use Acedit to tighten your profile content, keep your messaging in sync, and test different resume wording or outreach angles to see what gets a better response.
How long should I test a dashboard change before judging results?
For a new dashboard setup, like a query or data filter, test it against a 2-week sample before it goes live. That gives you enough data to check precision without waiting too long.
For broader branding changes, stick to a quarterly schedule. Some metrics give you near real-time signals, which helps when you need to pivot fast. Others take a full quarter before you can spot a meaningful shift in personal brand performance.