
If I had to sum up 2026 in one line, it’s this: transportation teams that use AI in daily work can cut costs, react faster, and avoid more downtime than teams still relying on manual planning.
Here’s the short version:
- Route optimization is often the best first move because it can cut fuel costs by 10% to 20% and show results in 3 to 6 months.
- Predictive analytics helps teams see demand swings and delays ahead of time, with forecast error cuts that can reach 28% to 32%.
- Real-time visibility and ETA prediction help planners focus on the loads that need attention, with payback often in 3 to 9 months.
- Predictive maintenance can flag vehicle issues 2 to 6 weeks before failure and cut breakdowns by up to 40%.
- Network planning takes more setup, but it can lower total logistics costs by 5% to 15% by changing how the network is built.
If I were choosing where to start, I’d keep it simple:
- Start with route optimization or real-time visibility for near-term savings.
- Move to predictive maintenance and network planning once data is cleaner and systems connect better.
- Treat data quality, system links, and time to ROI as the main filters when comparing tools.
Top 10 New Logistics Trends That Will Define 2026
sbb-itb-20a3bee
Quick Comparison
| AI trend | What it helps with | Main data needed | Typical time to ROI |
|---|---|---|---|
| Route optimization | Lower fuel use, fewer empty miles, faster dispatch decisions | GPS, traffic, weather, capacity, HOS | 3 to 6 months |
| Predictive analytics | Better demand planning, delay forecasting, pricing moves | Historical orders, weather, event data, telematics | 6 to 12 months |
| Real-time visibility & ETAs | Better shipment tracking, ETA accuracy, exception handling | GPS, telematics, traffic, weather, carrier feeds | 3 to 9 months |
| Predictive maintenance | Fewer breakdowns, less unplanned shop work | Engine diagnostics, sensor data, maintenance logs | 6 to 12 months |
| Network planning | Lower total logistics cost, better facility and lane decisions | ERP, TMS, WMS, lane history, carrier rates, facility costs | 6 to 9 months |
So if you want the plain answer: the fastest wins usually come from AI that plugs into dispatch and shipment flow today, while the bigger network and maintenance gains take more setup but can pay off over time.
1. AI Route Optimization
AI route optimization builds and updates routes nonstop. For transportation teams, it’s often the fastest near-term AI win. Modern systems test thousands of route combinations at the same time, looking at vehicle capacity, driver hours-of-service rules, time windows, weather, and live traffic - in seconds. Older dispatch tools usually need someone to step in and rework the plan when conditions change. AI keeps re-optimizing as traffic moves, drivers call out, or new orders come in.
Decision Speed
AI-driven TMS platforms can auto-reroute low-risk loads without waiting for dispatcher approval. Teams using autonomous planning have reported a 78% improvement in decision speed and a 75% improvement in decision quality.
Operational Impact
In April 2026, Inspired Go used Onfleet's AI route optimization to cut route planning time by 85% and scale without adding dispatch headcount at the same rate. Across the market, AI routing cuts fuel costs by 10% to 20%, reduces empty miles by about the same range, and lowers manual interventions by around 30%.
Data Requirements
Route quality depends on clean, live inputs. The data that matters most includes:
- Real-time traffic
- Road conditions
- Vehicle capacity limits
- Driver hours-of-service data
If a routing engine still needs manual data re-entry between systems, it gives up a lot of its speed edge.
ROI Visibility
Focused lane pilots can show results in 8 to 16 weeks, with payback in 6 to 9 months. The simplest way to measure impact is to track cost per shipment, empty miles, and on-time delivery against the same lanes’ pre-AI baseline.
Next comes prediction: using the same data to forecast delays and demand before they disrupt the plan.
2. Predictive Analytics for Delays and Demand
Predictive analytics takes those live signals and pushes them one step further: it estimates what’s likely to happen next. Instead of waiting for delays or demand swings to hit, it helps teams spot trouble early and act before operations get thrown off. These systems pull in live signals, flag likely disruptions, and can trigger moves like repositioning drivers or changing pricing.
Decision Speed
Most predictive models look 30 to 60 minutes ahead. In urban areas, they can predict demand one hour in advance with 92% accuracy.
That’s a different job than route optimization. Route optimization reacts to what’s already happening on the road. Predictive analytics helps shape supply before the spike shows up.
Operational Impact
The payoff can be pretty direct. AI demand forecasting cuts prediction errors by 28% to 32% and lifts peak-hour availability by 19% to 23%. It also reduces over-forecasting of ride requests by 31% to 36%, which means fewer drivers get sent out when they aren’t needed.
McKinsey reports logistics cost cuts of 5% to 20% and forecasting error reductions of up to 50%.
Data Requirements
Forecast accuracy lives or dies on data quality. If the data is messy, late, or stuck in separate systems, the model will struggle. Modern platforms can connect 12+ data sources, including weather APIs, event calendars, social media trends, public transit schedules, and past lane data.
Here are the main inputs:
| Data Input | Key Signals | Impact on Accuracy |
|---|---|---|
| Telematics | GPS, speed, engine diagnostics | High - real-time delay detection |
| Environmental | Weather, traffic, port congestion | High - external disruption forecasting |
| Demand | Historical orders, seasonal trends | High - capacity sizing |
| External | Event calendars, border queues | Medium - short-term spike prediction |
| Operational | Driver hours (HOS), fuel levels | Medium - constraint-based planning |
The biggest weak spot is usually integration, especially when companies run heavily customized legacy TMS and ERP setups. A smart question for vendors: ask for reference customers using the same TMS or ERP.
ROI Visibility
Early wins - like lower forecast error and better capacity balance - often show up in 8 to 16 weeks. Full ROI usually arrives in 6 to 12 months, which is faster than network optimization or digital twins.
To measure impact cleanly, track cost per shipment and on-time rates before and after deployment on the same lanes.
Once teams can predict disruptions, the next step is seeing them unfold in real time.
3. Real-Time Visibility and ETA Prediction
Real-time visibility shows what’s happening right now and what it means for the rest of the operation. In 2026, the gap between tracking and visibility matters a lot. Tracking is just a dot on a map. Visibility adds real-time operational context: why a vehicle is late, how that delay affects dock schedules, whether labor needs to shift, and when customers should be alerted. Prediction spots the risk. Visibility turns that signal into action.
Decision Speed
Modern visibility platforms pull in GPS and telematics data every 1 to 3 seconds, while live traffic feeds update every 2 to 5 minutes. AI agents working on top of that stream can check 15 to 20 variables at once, including driver hours of service, weather, border queues, and cancellation odds, then suggest a dock reassignment or send an exception alert within seconds.
That’s a major gap compared with manual dispatch. Manual planning cycles can take hours, and they tend to break down when teams are short-staffed. AI-driven systems scale with vehicle count, not headcount.
Operational Impact
The big shift is simple: teams only focus on the loads that need attention. Instead of watching every shipment all day, planners get alerts for the exceptions that call for action. In fleet operations, that cuts missed handoffs, late updates, and wasted labor.
Predictive ETA models like project44's now report over 90% accuracy within a two-hour window on the final day of transit. That kind of precision gives warehouses room to reschedule dock slots instead of keeping labor on standby for a truck that won’t arrive on time.
"A perfectly accurate ETA that lands in a dashboard nobody acts on changes nothing. Value is created when the ETA triggers something." - Tamas Domonkos, Logistics Expert
Data Requirements
The best systems need more than a GPS ping. The inputs that matter most are live traffic, weather APIs, driver hours-of-service (HOS) and ELD data, and past lane performance patterns. Some platforms also bring in connected vehicle data and smart-city traffic feeds to deal with the last blind spots still left in the network.
One thing trips up a lot of rollouts: poor system connections. For that reason, it makes sense to require native integration with your current TMS or ERP from day one. Data-flow gaps are often where these projects stall.
ROI Visibility
Many fleets see payback in 3 to 9 months, driven by fewer missed delivery windows, faster exception handling, and better asset use. Operators using AI-assisted dispatch report 14% higher revenue per vehicle than non-AI operators. And dynamic ETA refinement is still used by only 38% of surveyed transportation fleets, which leaves a clear opening for early movers to gain ground.
Once teams can spot disruption in real time, the next move is to stop breakdowns before they hit the road. The same live data that improves visibility can also help flag mechanical risk before it turns into downtime.
4. Predictive Maintenance and Fleet Operations
The same telematics stream used for ETA prediction can do another job too: spot mechanical trouble before it turns into a breakdown. ETA models explain delay risk. Predictive maintenance asks a different question: Is this vehicle about to fail? In 2026, machine learning tracks equipment wear in real time and forecasts failures before they happen.
Decision Speed
Old-school maintenance usually works one of two ways: fixed service intervals or fixing things after they break. AI-powered systems change that model.
They track engine diagnostics, tire pressure, battery voltage, vibration, and fuel efficiency all the time. From that data, the system can flag failures 2 to 6 weeks early. That lead time matters. It gives fleet teams room to plan repairs instead of scrambling after a roadside incident. Managers can slot work into low-demand periods instead of pulling vehicles out of service at the worst possible moment.
Operational Impact
The numbers are hard to ignore. AI-powered predictive maintenance can reduce vehicle breakdowns by 40% and cut unscheduled repairs by up to 30%. Unplanned downtime can fall by as much as 50% when the system is fully tied into fleet operations.
That changes the day-to-day workflow in a big way. Instead of digging through dashboards and service logs by hand, teams get automated alerts plus recommended next steps. Repairs can be moved into lower-pressure windows. Staff spend less time sorting alerts and more time fixing the issues that matter most.
FreshLine Logistics saved $180,000 per year, cut emergency repairs by 43%, and reached full ROI in 11 months.
Data Requirements
Forecast quality depends on two things: strong sensor coverage and clean maintenance records.
Some failure patterns need much denser sampling than standard one-per-second telematics can provide. Good models also use more than vehicle sensor data alone. They pull in inputs such as:
- Driver behavior
- Weather conditions
- Historical maintenance records
- Mileage
- Other outside operating factors
There’s another problem fleets run into: the data often lives in separate systems. Maintenance logs, ELD data, and dispatch platforms may not connect cleanly, which weakens failure forecasts.
Newer vehicles make this easier. In 2026, more than 90% of newly manufactured vehicles ship with factory-embedded telematics, which cuts down on hardware work and makes integration much cleaner.
ROI Visibility
For most fleets, predictive maintenance tools pay for themselves within 6 to 12 months. Even a focused pilot can show measurable impact within 8 to 16 weeks.
Next comes network-level planning, where AI uses fleet and shipment data to optimize the full transportation network.
5. Transportation Planning and Network Optimization
Route optimization helps teams run shipments better day to day. Network optimization looks at the system underneath those shipments: facility locations, freight flows, shipping modes, and long-term cost tradeoffs. In plain English, it doesn’t just improve the trip. It can reshape the map behind the trip.
Decision Speed
Route optimization reacts in the moment by reordering stops. Network optimization does something else: it runs scenario models that would have taken weeks and now can be done in minutes. That gives planners room to test big moves before spending money on them.
For example, a team can model what happens if it adds a regional distribution center, shifts freight from one mode to another, or changes port entry points. Platforms like Sophus now offer Digital Twin capabilities that can build a fully costed supply chain baseline in as little as 48 hours.
Operational Impact
A standard TMS usually works inside the network a company already has. AI network optimization can change that network itself. That’s the big difference.
Route optimization often cuts fuel costs by 10% to 20% on optimized lanes. Network optimization looks at the bigger cost picture across transportation, inventory, and facilities at the same time. That can reduce total logistics costs by 5% to 15%.
One 2026 example makes this concrete. A global manufacturer used Sophus to test hundreds of European network scenarios and cut total logistics costs by about 5%, while also improving customs processing and service levels.
Data Requirements
This is the heaviest setup burden across all five trends. And honestly, that makes sense. If you want to redesign a network, you need a lot more than route data.
Network optimization pulls from:
- Lane history
- Carrier rates
- Facility costs
- ERP and WMS records
- Total landed cost inputs such as duties and warehouse holding costs
It depends on connected data across the full supply chain, with more sources and systems than the earlier operational tools in this article.
ROI Visibility
Most teams see measurable ROI within 6 to 9 months. The larger savings, though, tend to build over time. That usually comes from structural changes like DC consolidation or mode shifts, where the payoff keeps stacking instead of showing up just once.
The next section compares this setup burden, decision speed, and ROI across all five trends.
How the 5 AI Trends Compare in Performance
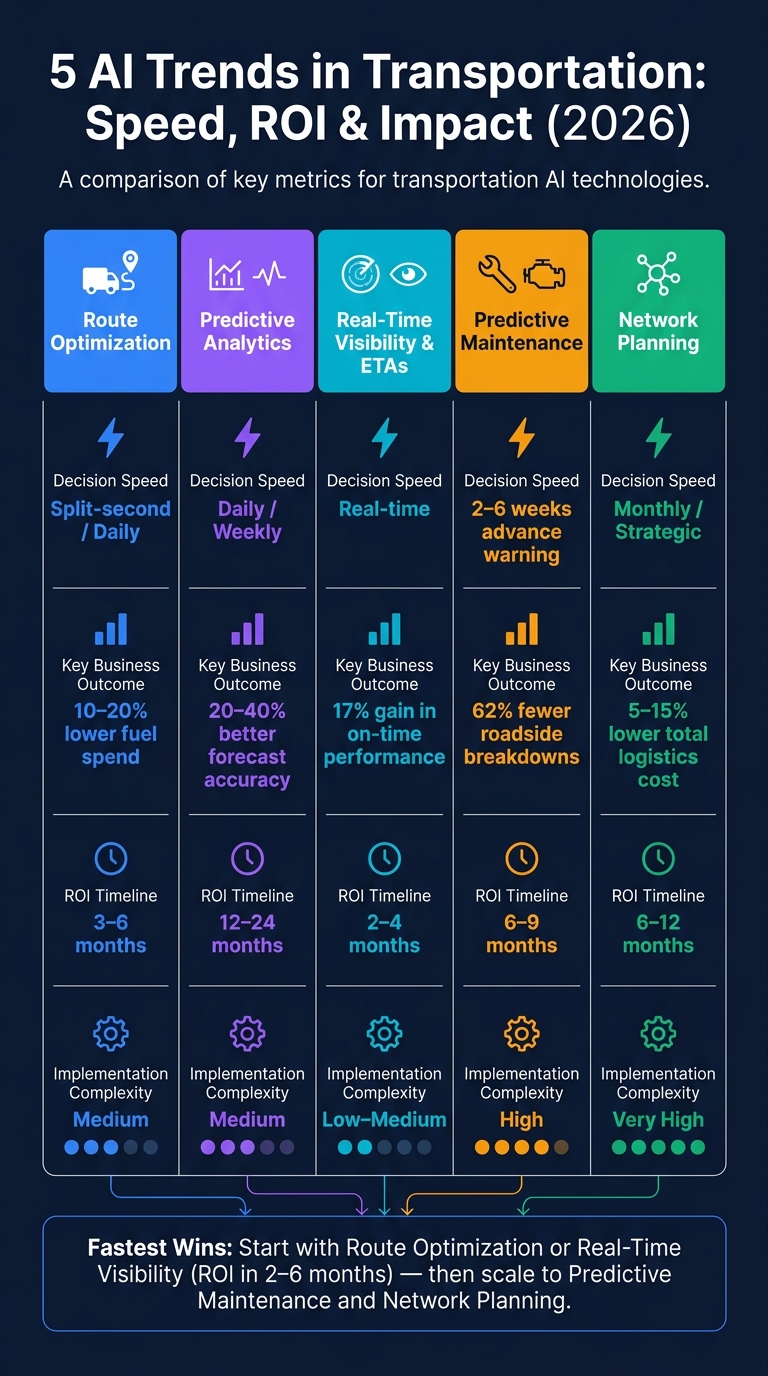
5 AI Trends in Transportation: Speed, ROI & Impact at a Glance (2026)
Each of these five AI trends tackles a different job, and each one moves at its own pace. Once the use cases are clear, the comparison comes down to three things: speed, data load, and ROI. In practice, decision speed is often the first filter. It helps teams decide where to begin.
The table below compares speed, data burden, business impact, and ROI.
| AI Trend | Decision Speed | Primary Data Inputs | Key Business Outcome | ROI Timeline |
|---|---|---|---|---|
| Route Optimization | Split-second / Daily | GPS, traffic, weather, vehicle capacity | 10–20% lower fuel spend | 3–6 months |
| Predictive Analytics | Daily / Weekly | Historical shipments, market trends | 20–40% better forecast accuracy | 12–24 months |
| Real-Time Visibility & ETAs | Real-time | Carrier feeds, port data, weather | 17% gain in on-time performance | 2–4 months |
| Predictive Maintenance | 2–6 weeks advance | Engine diagnostics, maintenance logs | 62% fewer roadside breakdowns | 6–9 months |
| Network Planning | Monthly / Strategic | ERP/TMS data, facility costs, lane history | 5–15% lower total logistics cost | 6–12 months |
Decision Speed Across the 5 Trends
Route optimization and visibility move the fastest. They help teams react in the moment or on the same day. Predictive maintenance comes next, giving teams a bit more lead time. Network planning is the slowest of the group, but it also affects some of the biggest cost drivers.
That gap in speed matters. Fast-moving tools can change daily execution almost right away. Slower tools tend to shape bigger planning decisions over time.
Operational Impact by Use Case
Each trend pushes on a different part of the business.
Route optimization and visibility usually improve fuel use and service levels first. Predictive maintenance reduces downtime by catching issues before they turn into breakdowns. Network planning works at a bigger level, changing fixed-cost choices like facility footprint, lane mix, and how freight moves across the network.
In other words, these tools are not doing the same job. Some help dispatchers today. Others help planners make better calls for the next quarter or year.
Data Requirements and Integration Burden
Real-time tools like route optimization and ETA prediction rely on GPS telemetry, live traffic, weather feeds, and carrier feeds. Many fleets already have at least some of that data in place, which makes the path shorter.
Predictive maintenance adds engine diagnostics and past maintenance logs. That usually means more systems to connect and more cleanup before the models are useful. Network planning has the heaviest data burden of the five, pulling from ERP or TMS data, facility costs, and lane history. If those systems don't line up cleanly, teams can hit delays before results show up.
That’s the tradeoff: lighter integration often leads to faster value.
How Fast Teams Can See ROI
Real-time visibility usually shows the fastest signal because on-time performance can improve quickly. Route optimization often delivers measurable fuel savings within 3 to 6 months. Predictive maintenance payback usually lands between 6 and 9 months.
Predictive analytics usually takes the longest to show returns. It depends more on historical data quality, model tuning, and teams using the forecasts in day-to-day planning.
Pros and Cons of Each AI Trend for Transportation Teams
Not every AI trend makes sense for every transportation team. The right pick depends on three things: how ready your data is, how much system integration you can handle, and how much process change your team can take on. That tradeoff matters. Some tools can drive gains fast. Others ask for much more system work before they start to pay off.
| AI Trend | Implementation Complexity | Data Dependence | Prediction Quality | Adoption Friction | Time to Scale |
|---|---|---|---|---|---|
| Route Optimization | Medium | High (Live GPS and constraints) | High (Execution-focused) | Medium (Drivers and dispatch) | Short - 8–12 weeks |
| Real-Time Visibility | Low to Medium | High (Carrier GPS and status feeds) | High (Dynamic ETAs) | Moderate | Short - 8–16 weeks |
| Predictive Analytics | Medium | High (Historical and event data) | Variable (Data-sensitive) | High (Planners) | Medium |
| Predictive Maintenance | High | High (Engine diagnostics) | Medium to High | High (Maintenance techs) | Long - data-heavy |
| Network Planning | Very High | Very High (Network-wide) | Strategic (Long-term) | Very High (Executives) | Long - process-heavy |
The fastest wins usually come from tools that slot into current dispatch and visibility workflows.
Where Route Optimization and Visibility Win Early
Route optimization and real-time visibility usually move from pilot to measurable results faster than the other trends. They plug into day-to-day dispatch and shipment tracking, so teams can spot value without waiting months.
They also lean on data many fleets already have, such as live GPS feeds and carrier GPS and status feeds. That keeps integration lighter and helps teams get moving sooner.
Where Predictive Maintenance and Network Planning Need More Setup
Here’s the tradeoff: the more data these systems need, the more setup they usually demand.
Predictive maintenance needs deep links to engine diagnostics, usually through OBD-II or J1939, along with past maintenance records before the models become dependable. Network planning takes even more work. It often needs 3–6 months for enterprise-scale implementation and pulls data from ERP systems, facility cost records, and full lane history.
If those systems are messy at the start, teams can end up spending more time cleaning records than using the models. That’s the part many teams underestimate.
What Makes Predictive Analytics Useful or Unreliable
Predictive analytics tends to work well when shipment and event data are clean, complete, and steady. It starts to slip when records sit in silos or demand changes fast.
Teams running on inconsistent legacy data often find that forecast errors stay high until those records are brought together. Put simply, weak inputs lead to weak outputs.
How Team Trust Affects Adoption
Even a strong model can fall flat if the people using it don’t trust what it tells them.
Drivers and dispatchers often push back when AI steps over human judgment without giving a reason. Teams usually get better traction when they position AI as decision support, not a replacement. A 60-to-90-day pilot on a defined set of lanes or vehicles, measured against a baseline, helps make that case in a way people can see for themselves.
Trust tends to grow when operators can compare baseline results with pilot results and see the difference in plain terms.
Conclusion
These five trends won’t fit every team the same way. The main differences come down to speed, data load, and ROI. So the path is pretty clear: go after fast wins first, then take on deeper system changes.
Best Fits for Near-Term Efficiency
For near-term efficiency, route optimization and real-time visibility stand out. Most fleets already have the core data for both through GPS and ELD feeds, and both touch daily, high-volume work where even small gains can add up fast.
AI route optimization usually cuts fuel costs by 10% to 20% on optimized lanes. Visibility tools can often go live in 8 to 16 weeks with light integration. That’s why visibility and ETA accuracy are usually the best place to start. They’re easier to launch, and the results are easier to show.
Best Fits for Long-Term Change
For deeper change, predictive maintenance and network planning are the next step. These use cases fit teams that already have cleaner data and better-connected systems.
Predictive maintenance can reduce roadside breakdowns by up to 62% in the first year of deployment. But there’s a catch: it needs clean engine diagnostic data and deeper ties to onboard systems. Network planning has a similar pattern. It depends on lane and facility history, and it often takes months to put in place. That makes it a better fit for teams ready for heavier integration and a longer payback period.
In 2026, transportation teams get the best results when they match AI use cases to their current data readiness, then expand from execution into planning.
FAQs
Which AI use case should my team start with first?
Start with high-volume, repetitive work your team deals with all the time, like routine dispatch messages or common exception handling.
Then run a 30- to 60-day pilot in a small slice of your operation. Measure the results against your baseline before you roll anything out more broadly.
For transportation and fleet teams, the clearest ROI often comes from:
- predictive driver allocation
- dynamic ETA refinement
- automated quote generation
What data do we need before adopting AI in transportation?
Start with clean, high-quality data and an honest read on your current data maturity.
First, confirm what data you collect. Then check whether that data is accurate, complete, and up to date. If your systems live in separate silos, connect them. That usually means pulling together data from your transportation management system, ERP, WMS, and telematics so you can see the same picture in one place.
You’ll also want a baseline for the metrics that matter most, such as:
- Cost per shipment
- Empty miles
- On-time rates
- Fuel spend
Once you have that baseline, test AI in a 30-day pilot. Use your actual constraints, your day-to-day workflows, and the same operating conditions your team deals with now. That gives you a much clearer sense of whether the tool can help in practice, not just in a demo.
How can we measure AI ROI in transportation?
Measure AI ROI by setting clear baseline metrics before implementation. Start with numbers like fuel cost per mile, accident rates, maintenance spending, and compliance violations.
Then run a 30- to 60-day pilot on a few workflows or a small part of the fleet. That gives you a clean way to see what changed without rolling it out everywhere at once.
From there, compare pilot KPIs against your baseline. That makes it easier to calculate savings in:
- Fuel
- Labor
- Asset use
In many cases, payback is reached in 4 to 14 months.